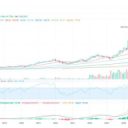
| If you ask AI, you get similar answers, and it's mostly stuff you already know, but since some of you might be busy, I'll share what I found. As you mentioned, SOXX's actual stock price is currently moving in the 520–530 range. It rose to an intraday high of 539.54 today before giving back some of its gains to battle around the524.14 level [1.1.1, 1.2.1]. Based on current real-time market data and the 3-month average trading volume, reflecting accurate figures, I present a completely revised buy/sell strategy. - Analysis of Today's Trading Volume vs. 3-Month Average
Today's Volume: Approx. 6.33 million shares (as of market close) [1.1.1] Recent 3-Month Average Daily Volume: Approx. 9.73 million shares [1.2.3] Difference & Characteristics: Today's trading volume is down about 35% compared to the recent 3-month average [1.1.1, 1.2.3]. In the early session, trading briefly surged amid a rebound attempt, but ahead of this week's Big Tech earnings releases, large institutions and major trading entities turned to a wait-and-see attitude, causing buying pressure to completely dry up in the later part of the session. Because the rebound lacked volume backing, it lost its upward momentum during the day and slipped back down [1.1.1, 1.2.1]. Intraday Trend & Sentiment Reason for the Rise and Fall: Early in the session, the Philadelphia Semiconductor Index attempted a rebound driven by bargain hunting [1.2.4]. However, investor caution reached an extreme ahead of Big Tech earnings reports, starting with Alphabet (Google) and Tesla on Wednesday (the 22nd) of this week [1.2.4]. In particular, regarding the valuation of AI semiconductors which has sparked overvaluation debates, there was a strong sentiment of "let's verify with our own eyes whether Big Tech is actually maintaining AI infrastructure spending (CAPEX)." This halted buying pressure mid-day, and profit-taking and risk-management selling pulled the index down [1.1.5, 1.2.4]. - Summary of Recent News & Outlook
News in Brief: There is psychological pressure as the Philadelphia Semiconductor Index has fallen about 20% from its recent peak ($655.95), entering a technical bear market [1.2.3]. However, this is countered by the view that the underlying demand for AI semiconductors remains unchanged, as demonstrated by TSMC's solid earnings guidance. Future Outlook: If this week's earnings from Alphabet and Tesla on Wednesday (22nd) confirm that the scale of Big Tech's AI infrastructure investment (CAPEX) is maintained or increased, selling pressure is likely to ease and spark another upward rally. On the other hand, if concerns about spending slowdowns arise, we must leave the door open for further corrections down to near the recent lows. Semiconductor Index Enters "Short-term Bear Market": News that the Philadelphia Semiconductor Index has fallen more than 20% from its late-June high, officially entering technical bear market territory, is putting pressure on the market [1.2.3]. News on Google's In-House AI Chip Development: Reports surfaced that Alphabet (Google) is developing its own "Gemini-integrated server chips" to improve AI efficiency and reduce server costs. Consequently, memory makers like Micron and SanDisk surged early on, while existing chip design firms like Nvidia faced long-term competition concerns, leading to mixed stock performances [1.2.4]. Regulatory & Infrastructure Risks: News that some regions, including New York, are considering restricting or regulating data center construction stimulated concerns over a slowdown in AI chip demand [1.2.5]. - 💡 SOXX Real-Time Price-Based Buy/Sell Strategy
These are target prices responding to technical support and resistance levels, based on the current price (around $524.14) and the 52-week high ($655.95) [1.1.1, 1.2.3]. 1 1st Split Buy Range (Entry) Support test near current price Around $500 ~ $515 This is just above the intraday low ($498.54) recorded on the previous trading day (the 17th) during the recent sharp drop [1.1.2]. If downside support is established at the current $520 level, considering the risk ahead of earnings releases, it is a good price range to enter with just 20–30% of your total planned volume first. 2 2nd Strong Buy Range (Increasing Allocation) In case of earnings shock or additional correction Around $450 ~ $470 If Big Tech earnings this week miss market expectations and cause the semiconductor sector to drop once more, this is the range where strong support from major volume profiles is waiting. If the price falls to this level, it is effective to deem it oversold and aggressively increase your position to over 60–70%. 3 Short-Term Sell & Profit-Taking Range Upon rebound from strong earnings Around $570 ~ $585 In the event of strong earnings causing a V-shaped rebound, this is the level (short-term resistance) that served as support in early-to-mid July before collapsing [1.1.2]. If you want to secure short-term trading margins, it is advantageous to take profit on about half of your position in this range to secure cash. 4 Medium-to-Long-Term Target Price Upon trend recovery in the second half Around $630 ~ $650 If concerns over Big Tech earnings are resolved and momentum is carried over to Nvidia's earnings at the end of August, an attempt to reclaim the previous high ($655.95) is possible [1.2.3]. Hold long-term investment volumes up to this price range to maximize profits. Conclusion & Tips: Today's intraday rise and subsequent fall showed the limits of a technical rebound lacking volume. There is absolutely no need to rush just because the price is around the 520 level. I recommend calmly accumulating in splits while checking the Big Tech earnings results this Wednesday and seeing if support holds at500–$515. - -- -- --> Many people use AI. They get similar answers and react in their own ways. Although we cannot trust AI's data 100%, please use it as a good guide to manage your psychology well and have successful trading. |